To see the 2024 Grant Recipient Summary, click here.

OC Equity Map

Mapping the Disparities

The OC Equity Map spotlights social and health disparities in Orange County neighborhoods. This interactive map visualizes 580 census tracts across the county and displays scores from the Social Progress Index (SPI), Centers for Disease Control (CDC) Health Indicators, and population demographic data. This tool allows our communities to identify what health inequities exist and where they are most felt, so we can work together to eliminate them.

The OC Equity Map is powered by our consultant partner Advance OC.

OC Equity Map

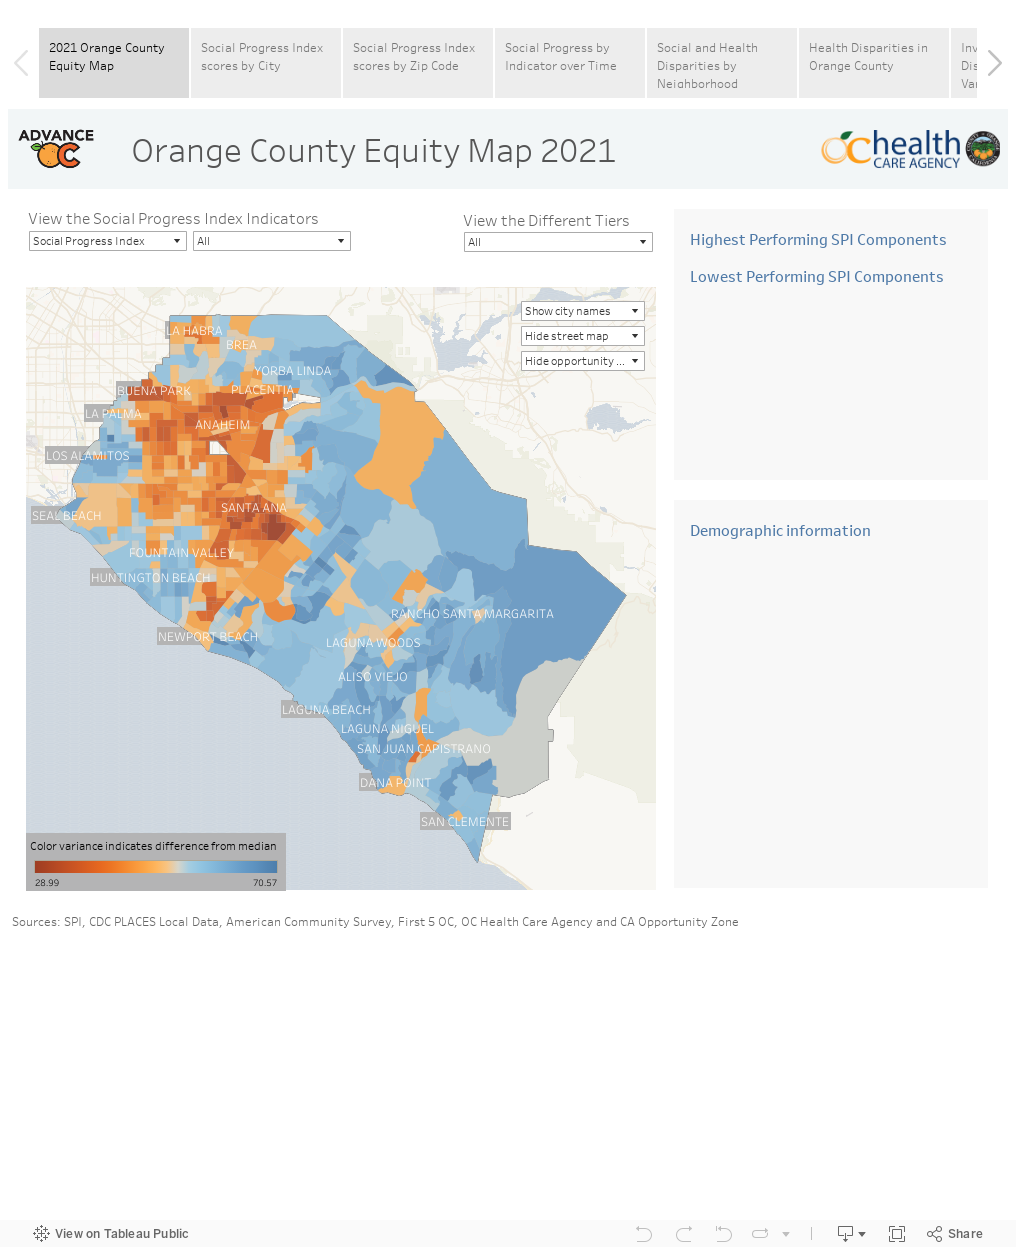
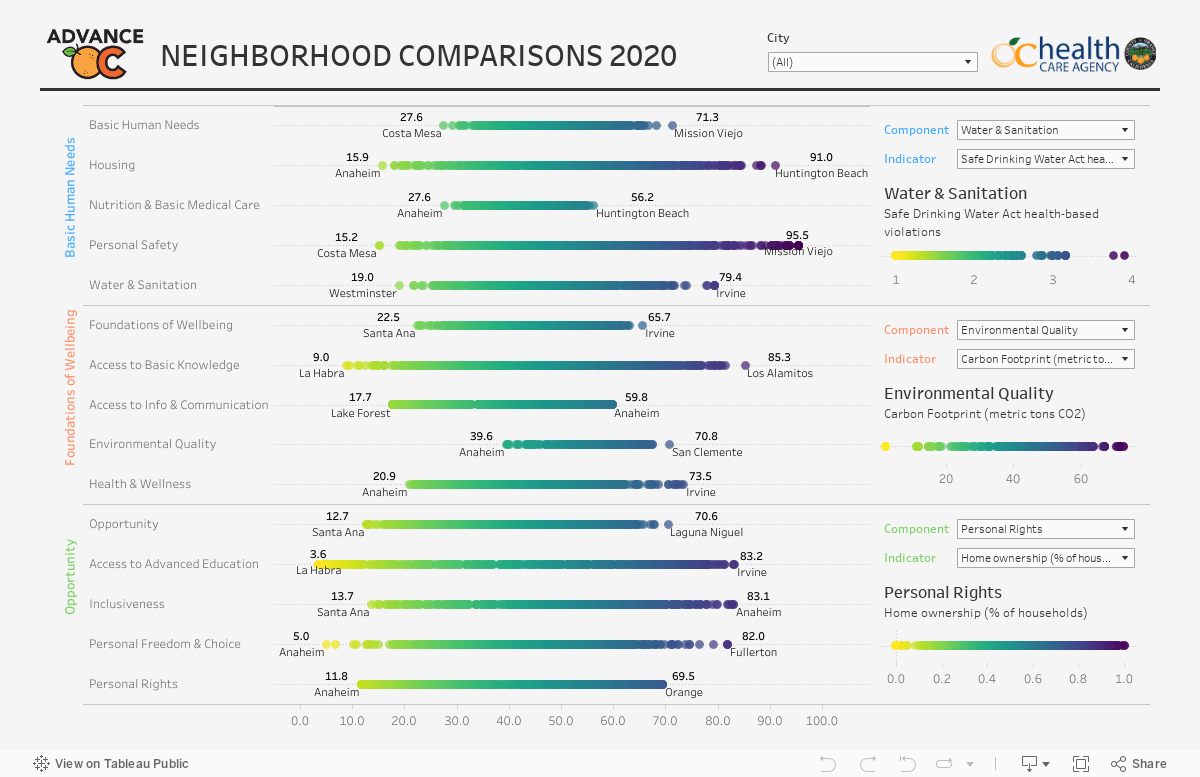
The foundation of the OC Equity Map is a set of social and environmental metrics called the Social Progress Index, incorporating 50 indicators that measure the health and wellness of a community.

  • Use the dashboards to search by address, city, ZIP Code, or neighborhood census tract to view the corresponding Social Progress Index component scores.
  • Explore the different overlays to get additional information on individual neighborhoods.
  • Each map contains the respective population weighted average.
  • Different cities or ZIP Codes are represented on every individual scale for users to benchmark.

Neighborhood Comparisons

Correlation Analysis by Neighborhood

COVID-19 Vulnerability Map

Social Progress Index